Original research / advertised compensation
Remote Finance Salary Statistics 2026: Inside 724 Listed Pay Ranges
An original analysis of US-listed, remote-tagged finance jobs: salary midpoints, six-figure floors, category differences and national benchmarks—with downloadable data.
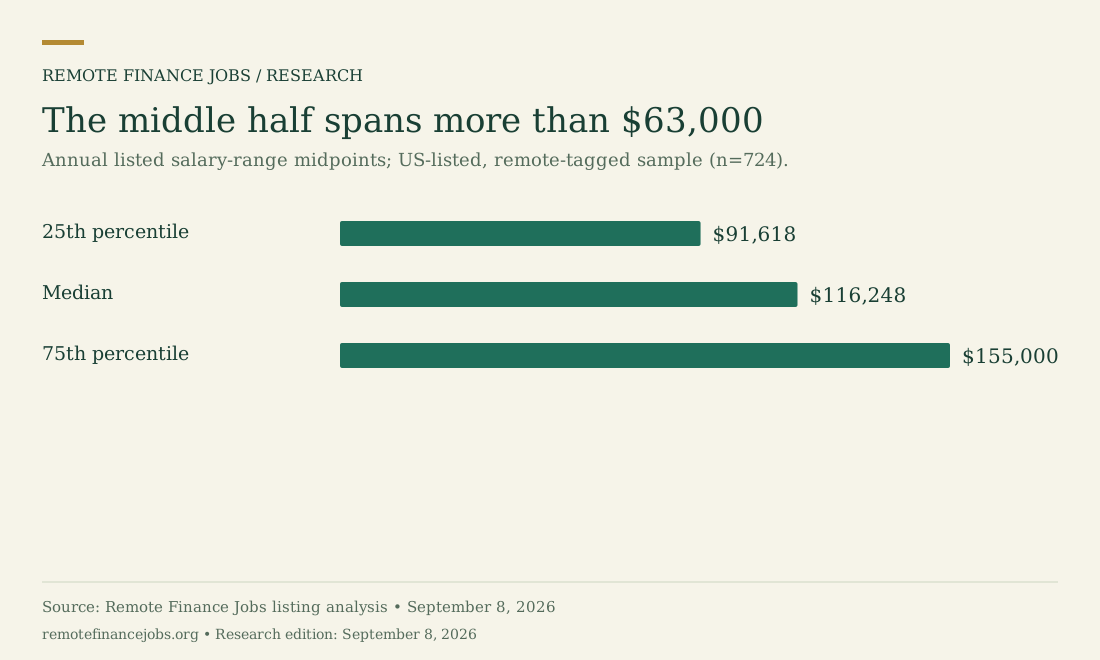
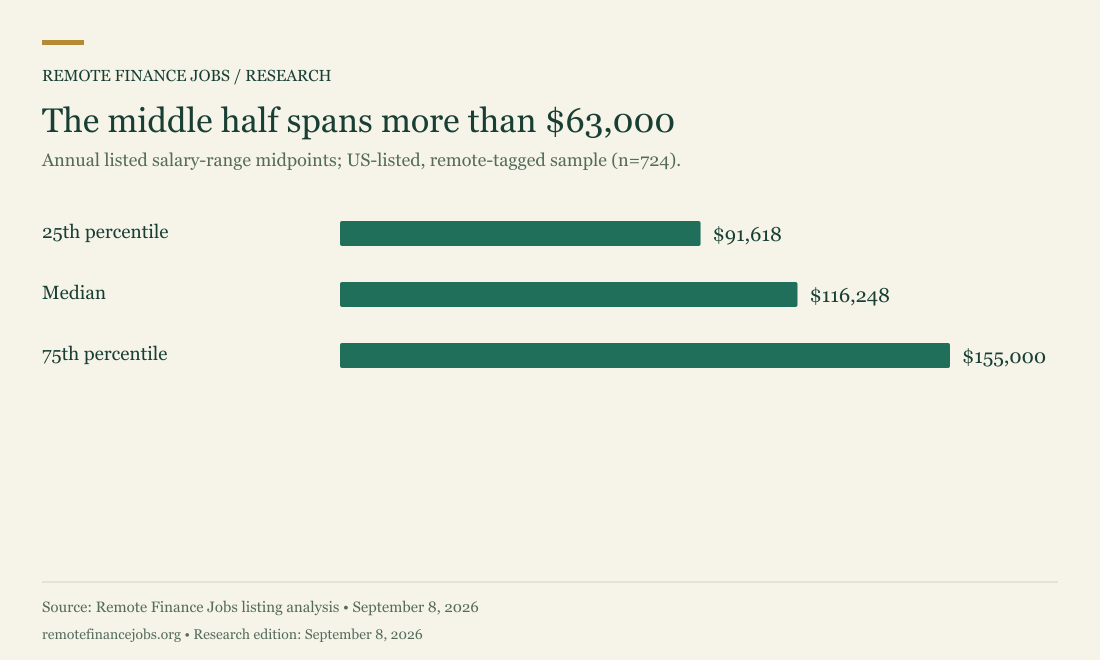
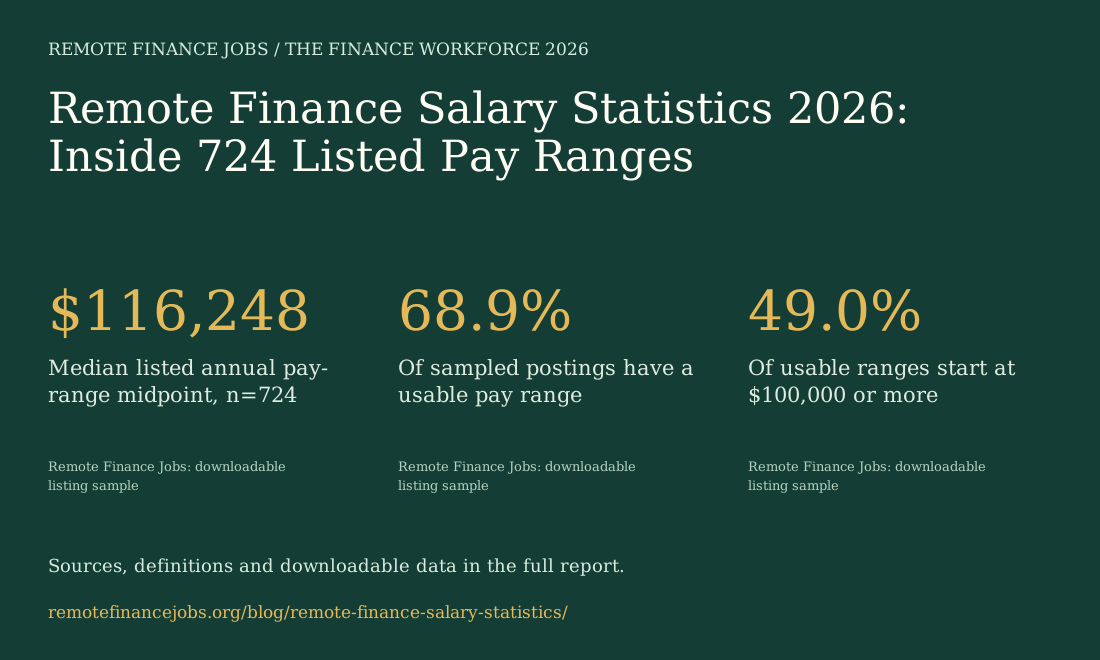
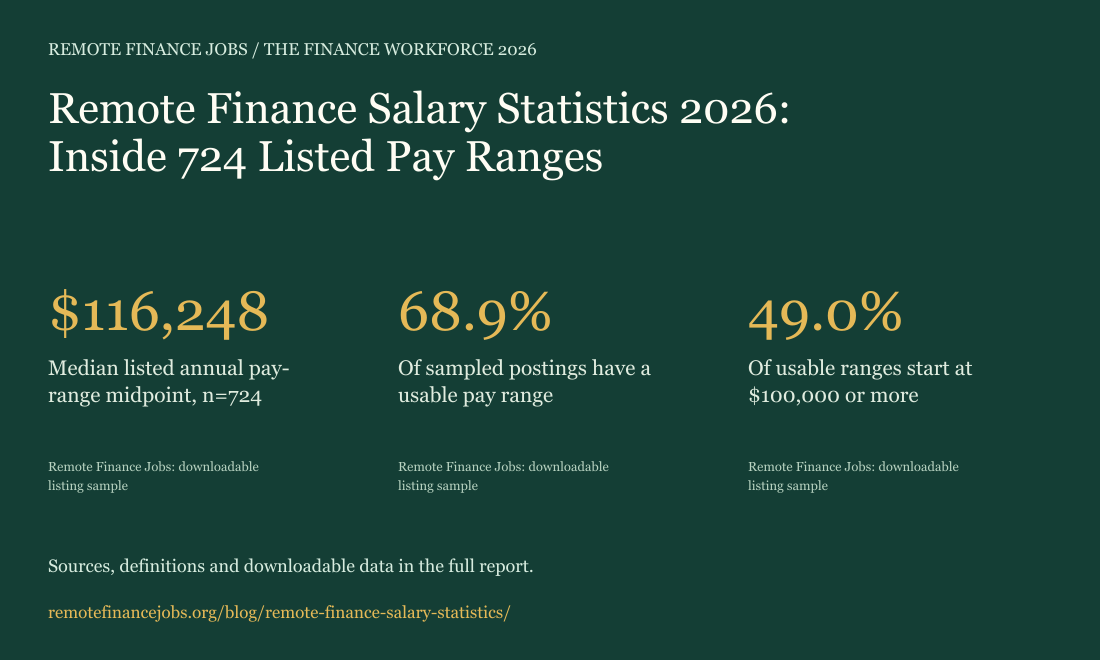
What do remote finance jobs pay? In our September 8, 2026 sample, the median listed annual salary-range midpoint was $116,248 across 724 usable ranges. The middle half ran from $91,618 to $155,000. These are advertised ranges in US-listed, remote-tagged postings—not a survey of what remote employees actually earn.
The wider dataset contains 1,051 deduplicated employer-title pairs across 831 normalized employer names. Its value is transparency: readers can inspect the source listing sample, see the exclusion rules and distinguish a salary ceiling from a minimum offer.
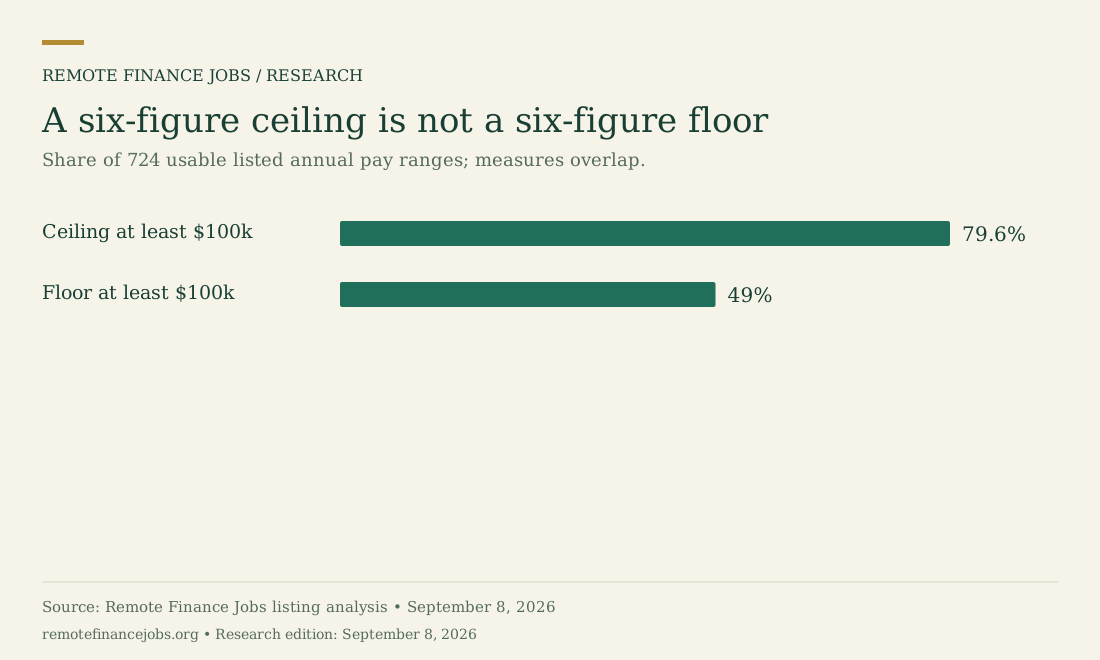
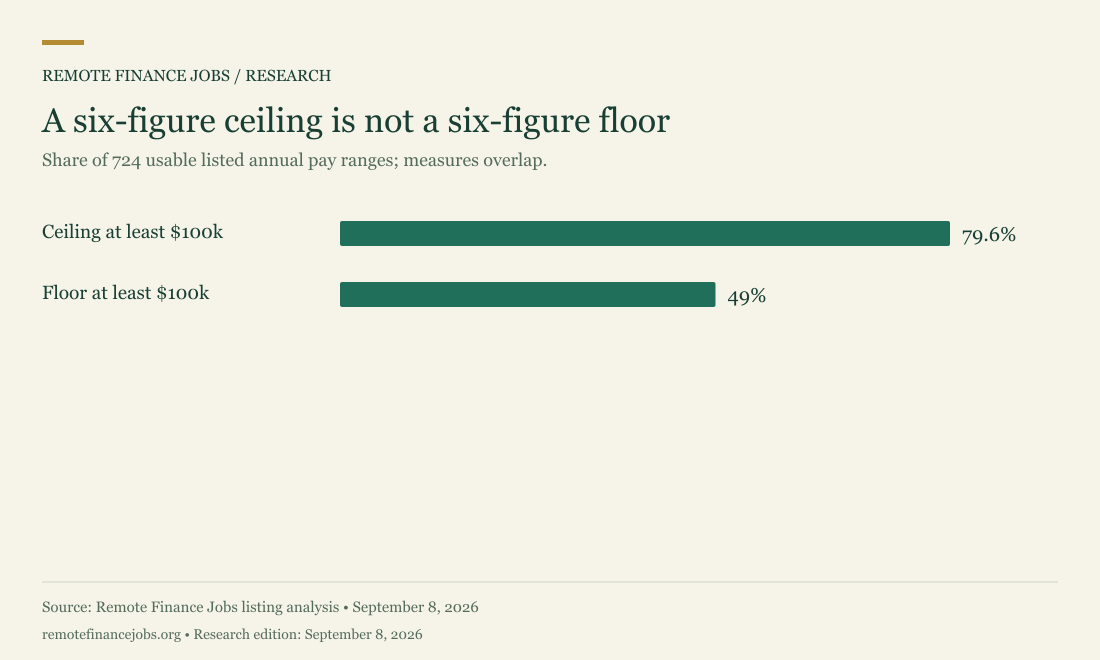
A six-figure ceiling is much more common than a six-figure floor: 79.6% of usable ranges reach $100,000, but only 49.0% start there. A headline based on the top of each range would overstate the guaranteed pay.
01 / THE DATA
The pay snapshot, with the denominator visible
Each posting contributes one midpoint: (annual minimum + annual maximum) ÷ 2. We take the median of those midpoints so very high ranges do not dominate the summary. Missing or mechanically excluded ranges are left out rather than treated as zero.
A midpoint is a description of a posted interval. It is not a promised starting salary, a total-compensation estimate or a prediction of an accepted offer. Because coverage is incomplete, the pay-visible subset may differ from the rest of the sample.
| Sample measure | Result | Denominator / meaning |
|---|---|---|
| Deduplicated remote-tagged postings | 1,051 | US-listed employer-title pairs |
| Normalized employer names | 831 | Sampled employers |
| Usable annual ranges | 724 | Both bounds pass checks |
| Missing or excluded ranges | 327 | 1,051 − 724 |
| Usable-range coverage | 68.9% | 724 / 1,051 |
| 25th percentile midpoint | $91,618 | 724 ranges |
| Median midpoint | $116,248 | 724 ranges |
| 75th percentile midpoint | $155,000 | 724 ranges |
02 / THE DATA
Category matters more than one overall number
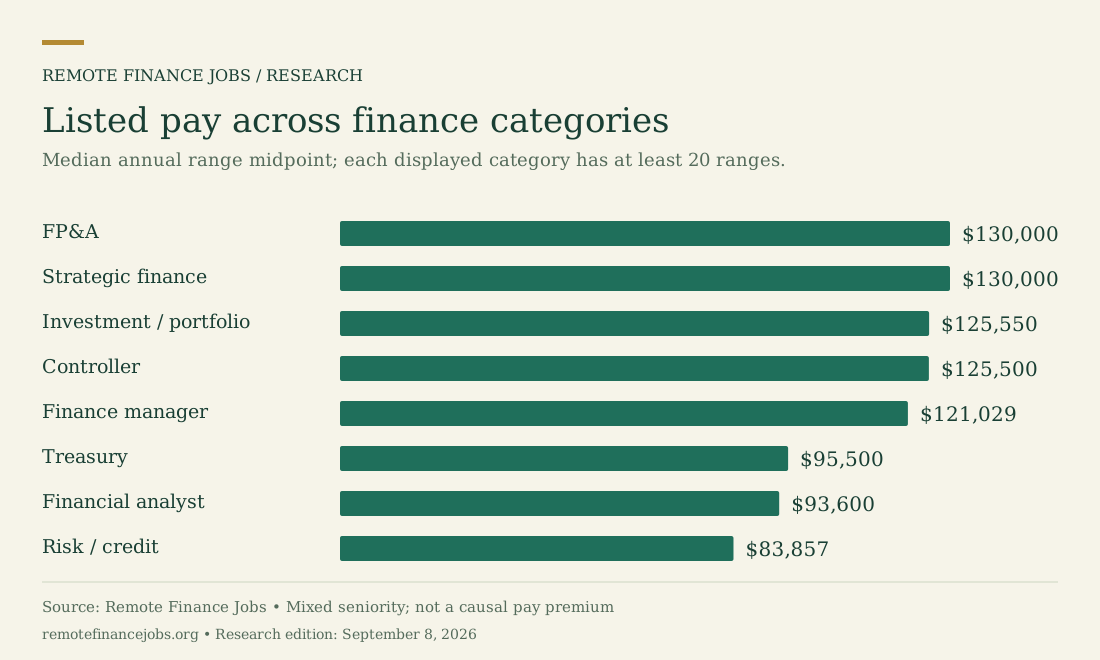
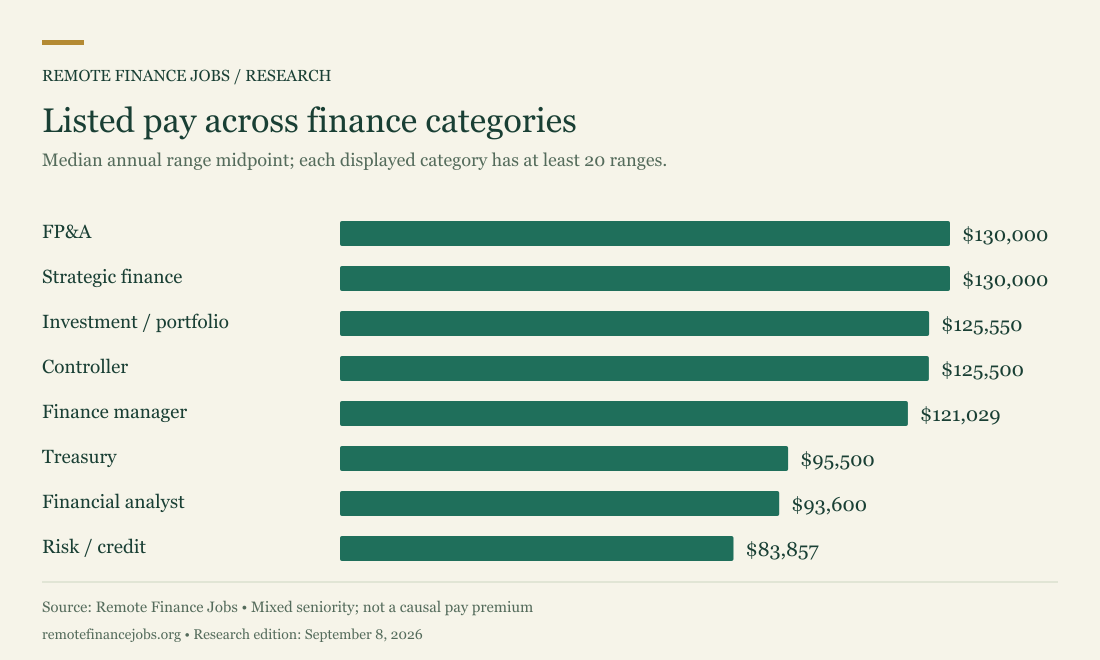
The category table separates eight groups with at least 20 usable pay ranges each. FP&A and strategic finance share the highest median midpoint among these displayed categories. The financial-analyst category sits below the overall sample median.
This is a descriptive comparison, not a controlled salary premium. Categories contain different seniority levels, employers and locations, and the source pipeline’s labels can be imperfect. Read sample size and the middle-half interval alongside the median before comparing categories.
| Pipeline category | Usable ranges | Median midpoint | Middle 50% |
|---|---|---|---|
| FP&A | 267 | $130,000 | $101,723–$162,500 |
| Controller | 116 | $125,500 | $106,250–$163,125 |
| Financial analyst | 115 | $93,600 | $75,960–$109,358 |
| Finance manager | 60 | $121,029 | $101,587–$156,225 |
| Treasury | 39 | $95,500 | $86,250–$127,473 |
| Investment / portfolio | 40 | $125,550 | $109,500–$150,000 |
| Strategic finance | 26 | $130,000 | $95,125–$175,025 |
| Risk / credit | 27 | $83,857 | $67,080–$112,147 |
03 / THE DATA
The six-figure headline test: floor or ceiling?
Of the 724 eligible pay ranges, 576 have a maximum of at least $100,000, versus 355 with a minimum of at least $100,000. The difference is 221 postings: their ranges cross the threshold, but their lower bounds remain below it.
A pay filter using maximum salary answers “could this range reach six figures?” A filter using minimum salary answers “does the listed range begin at six figures?” Both are useful, but they are different questions. Neither confirms the final compensation package.
| Threshold measure | Postings | Share of 724 ranges |
|---|---|---|
| Maximum ≥ $100,000 | 576 | 79.6% |
| Minimum ≥ $100,000 | 355 | 49.0% |
| Maximum ≥ $100,000; minimum below it | 221 | 30.5% |
04 / THE DATA
National wage benchmarks are a different measurement
For context, the table below reports BLS median employee wages across all work arrangements. It should not be used to calculate a “remote premium” against our listing sample: the occupation mix, pay measure, reference period and worker population are different.
This distinction is especially useful when setting a negotiation range. A job ad describes an employer’s stated interval for a vacancy. An occupational median describes the midpoint of a wage distribution among workers covered by that source. Neither automatically captures equity, self-employment income or every bonus arrangement.
| Occupation | Median annual wage | Source / period |
|---|---|---|
| Financial managers | $166,570 | BLS, May 2025 |
| Financial risk specialists | $117,330 | BLS, May 2025 |
| Personal financial advisors | $105,070 | BLS, May 2025 |
| Financial and investment analysts | $102,740 | BLS, May 2025 |
| Financial examiners | $94,160 | BLS, May 2025 |
| Budget analysts | $91,640 | BLS, May 2025 |
| Accountants and auditors | $83,680 | BLS, May 2025 |
| Bookkeeping / accounting / auditing clerks | $50,670 | BLS, May 2025 |
05 / THE DATA
What the 2026 salary outlook adds
Robert Half’s 2026 guide projects average salary gains of 2.1% across finance/accounting, 3.7% in public accounting tax/audit/assurance, 2.9% in payroll and 2.2% for tax professionals outside public accounting. These are guide projections, not observed wage increases for every employee. Source: compensation trends.
For hiring teams, the most useful benchmark combines function, seniority, geography and a clearly defined compensation basis. For candidates, ask whether a posted range represents base pay, variable compensation, multiple locations or several levels. Our finance job market statistics provide the hiring context, and our remote accounting report isolates accounting-related titles.
RESEARCH NOTES
Methodology & reuse
This report was researched on September 8, 2026. Dates beside statistics identify the observation or forecast period; “2026” in the title is the publication edition. National occupational data cover all work arrangements. Employer surveys describe respondents, and projected openings are not a count of currently unfilled jobs.
You may reuse charts created by Remote Finance Jobs with a link to this article. Keep source credits, dates and population labels attached. Downloadable CSV files reproduce the article tables; follow their source links for the underlying publishers’ definitions. We have not conducted an independent national employer survey.
The original analysis starts with 1,457 local listing records collected from Indeed and last seen September 8, 2026. We retain new/active records seen within 14 days, dated no more than 90 days earlier where a posting date exists, marked remote, with a US location ending “, US”, and matching the board’s finance-title relevance rules. This leaves 1,374 records. Deduplicating normalized employer plus title removes 323 repeated records and leaves 1,051 employer-title pairs. The first retained record supplies location and pay; distinct same-title vacancies can therefore be merged.
“Remote-tagged” means the source record flags the listing as remote. It is not an independent verification of fully remote eligibility: hybrid work, office attendance or geographic restrictions may appear in the description. This convenience sample reflects the board’s search coverage, not the entire US labor market. All records come from one platform; no market-wide remote share, trend or causal pay premium is estimated.
Salary calculations use the existing annualized minimum and maximum fields for US listings, interpreted in USD. Eligible ranges have a minimum of at least $20,000, maximum no greater than $500,000, maximum at least the minimum, and maximum/minimum no greater than 3. Missing and excluded ranges are not zero salaries. These mechanical checks do not verify every original pay period, bonus component or employer estimate. Medians describe listed range midpoints, not employee earnings or accepted offers. Quartiles use linear interpolation; dollars are rounded for display.
Categories are the source pipeline’s primary labels and can contain classification errors. Category salary summaries require at least 20 eligible ranges. The accounting subset uses titles containing accountant, accounting, controller or comptroller. This includes senior leadership and excludes bookkeepers without those title terms; it is not a representative staff-accountant sample. Download the row-level sample and inclusion flags to inspect or reproduce the calculations.
Suggested citation: Remote Finance Jobs Research. “Remote Finance Salary Statistics 2026: Inside 724 Listed Pay Ranges.” September 8, 2026. https://remotefinancejobs.org/blog/remote-finance-salary-statistics/
Sources & reference periods
- Remote Finance Jobs: downloadable listing sample ↗September 8, 2026; US-listed, remote-tagged, deduplicated Indeed sample · Accessed September 8, 2026
- BLS: Financial managers ↗May 2025 wages; 2025–2035 projections · Accessed September 8, 2026
- BLS: Financial analysts ↗May 2025 wages; 2025–2035 projections · Accessed September 8, 2026
- BLS: Personal financial advisors ↗May 2025 wages; 2025–2035 projections · Accessed September 8, 2026
- BLS: Financial examiners ↗May 2025 wages; 2025–2035 projections · Accessed September 8, 2026
- BLS: Budget analysts ↗May 2025 wages; 2025–2035 projections · Accessed September 8, 2026
- BLS: Accountants and auditors ↗May 2025 wages; 2025–2035 projections; updated August 27, 2026 · Accessed September 8, 2026
- BLS: Bookkeeping, accounting and auditing clerks ↗May 2025 wages; 2025–2035 projections · Accessed September 8, 2026
- Robert Half: Finance and accounting compensation trends ↗2026 salary-guide projections · Accessed September 8, 2026