Labor market / demand & opportunity
Finance Job Market Statistics 2026: Where the Hiring Demand Really Is
A source-linked US finance labor-market briefing: occupational growth, annual openings, employer hiring plans and why a fast-growing role is not always the largest opportunity.
The finance job market is not one hiring cycle. Accounting, financial management, analysis, advice and examination differ in scale, entry requirements and projected growth. A small occupation can have an impressive growth percentage while generating fewer openings than a larger, slower-growing field.
This report pairs the latest BLS occupational outlook with employer research. It covers US finance occupations across industries, not only employees of banks or financial-services companies. Long-term projections and employer intentions are presented separately from observed job advertisements.
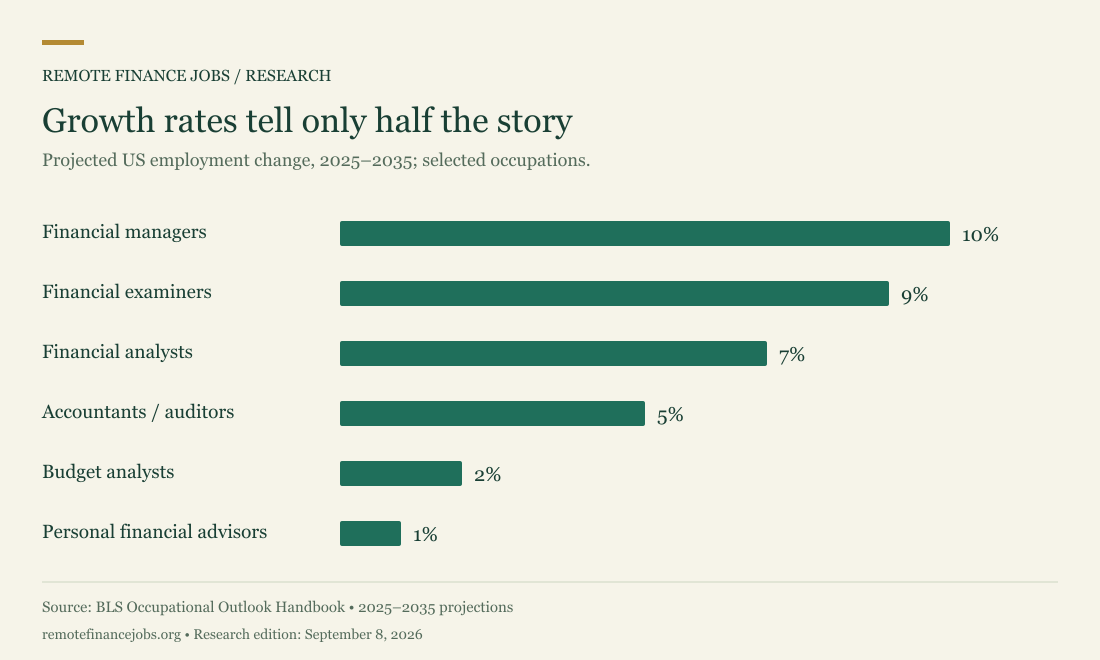
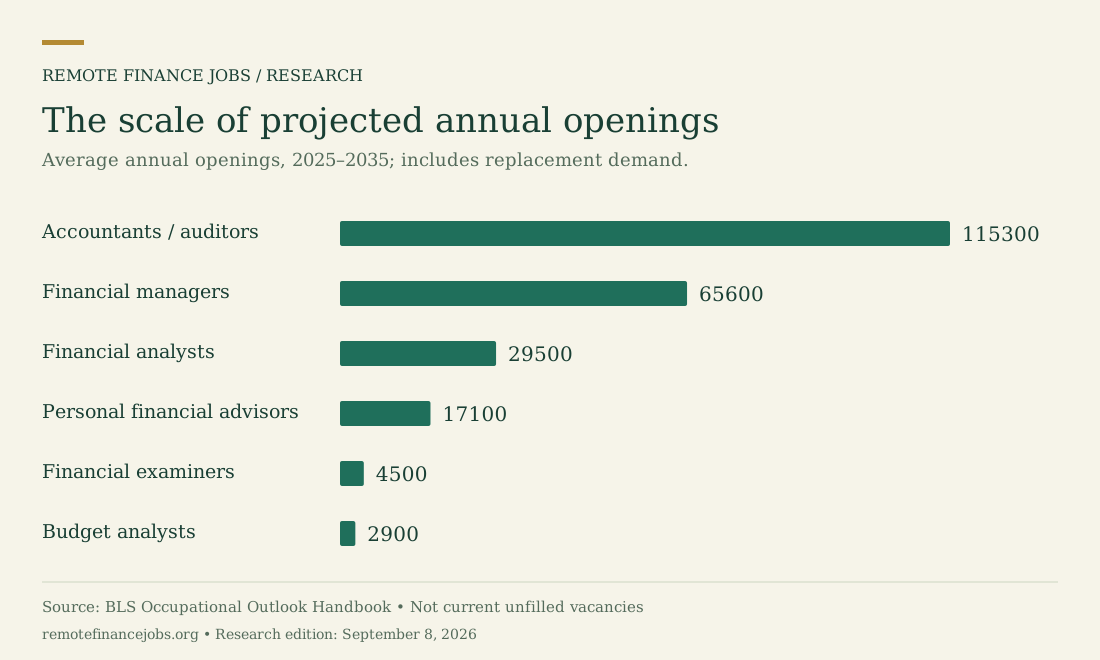
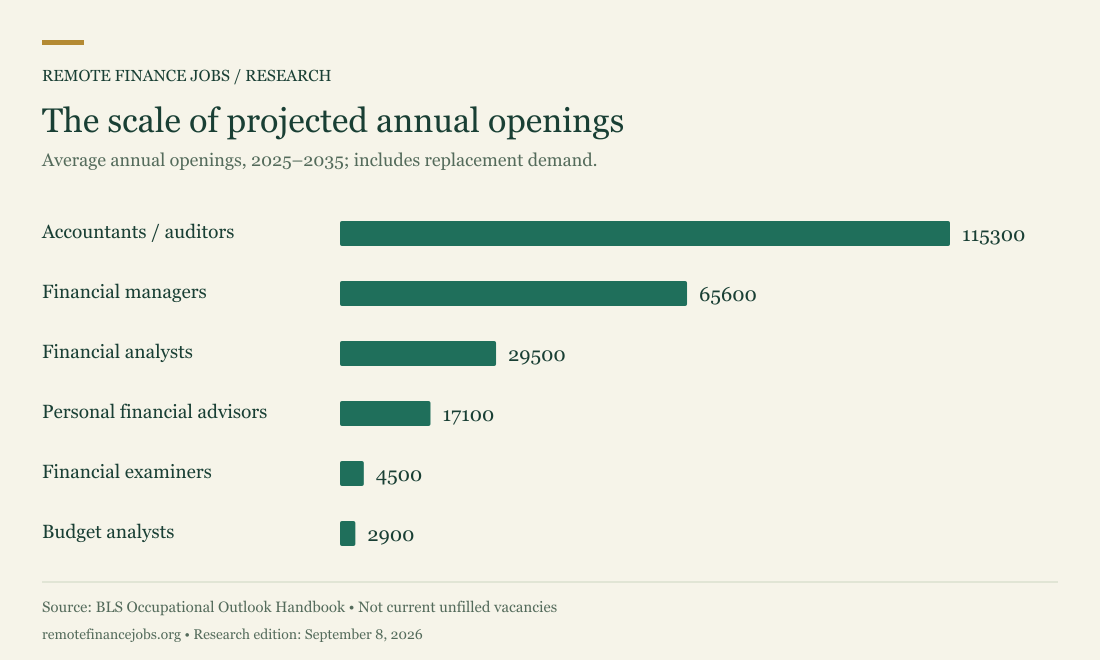
Compare both the growth rate and the number of openings. Growth describes direction; openings describe the scale of expected hiring opportunities, including replacement demand.
01 / THE DATA
Six occupations, six different opportunity profiles
The table uses the 2025–2035 projection vintage. Accounting has the largest annual openings estimate among these six groups, while financial management has the highest projected growth percentage. The financial-analyst row combines investment analysts and financial risk specialists.
Do not treat these selected occupations as a complete count of “finance jobs.” The selection excludes other finance-related work and spans distinct occupational groups. It is designed for comparison, not as a total industry employment estimate.
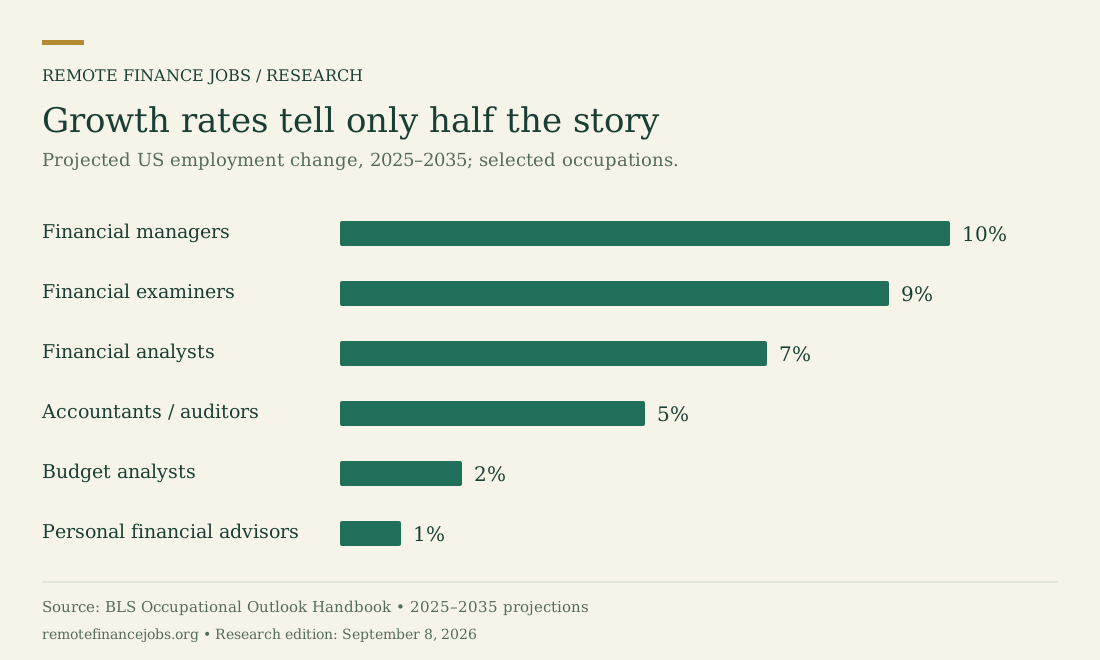
| Occupation | 2025 employment | 2025–35 growth | Annual openings |
|---|---|---|---|
| Accountants / auditors | 1,595,200 | 5% | 115,300 Source |
| Financial managers | 879,700 | 10% | 65,600 Source |
| Financial analysts (combined) | 443,100 | 7% | 29,500 Source |
| Personal financial advisors | 299,400 | 1% | 17,100 Source |
| Financial examiners | 70,000 | 9% | 4,500 Source |
| Budget analysts | 50,400 | 2% | 2,900 Source |
02 / THE DATA
A larger occupation can mean more openings
BLS separates employment growth from openings generated when workers leave an occupation or the labor force. The opening estimates therefore include more than newly created positions. The same distinction matters when a hiring market feels active despite modest net employment growth.
For job seekers, a long-term openings forecast is background context rather than a near-term probability of being hired. Availability in a specific city, remote policy, seniority and specialization still determine which positions are realistic targets.
03 / THE DATA
Employers plan to hire—but plans are not hires
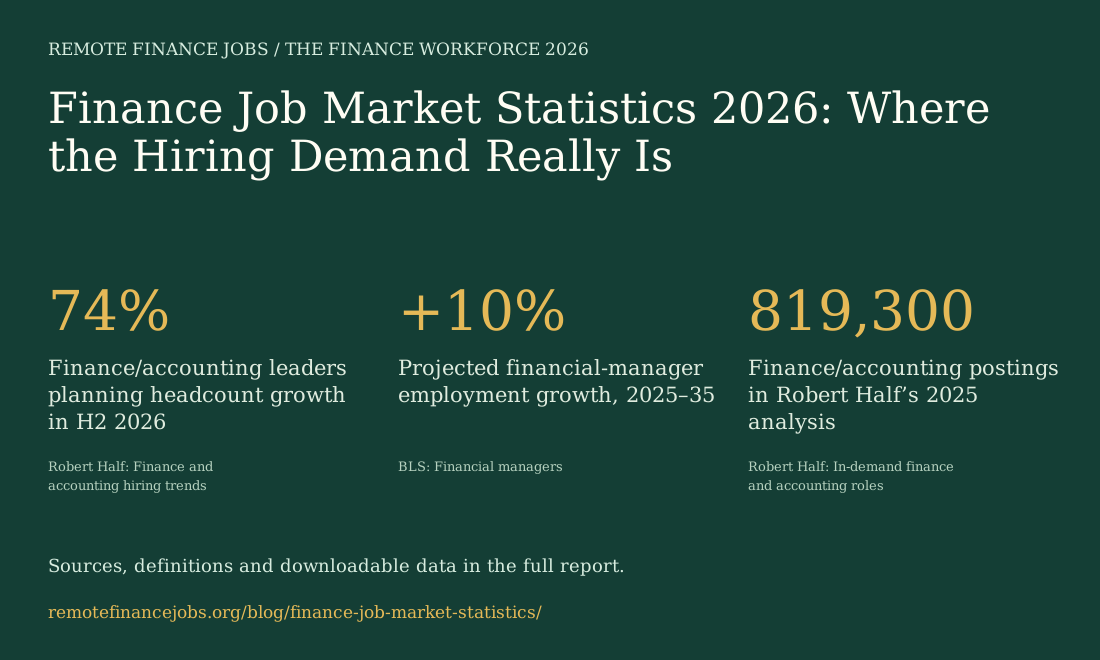
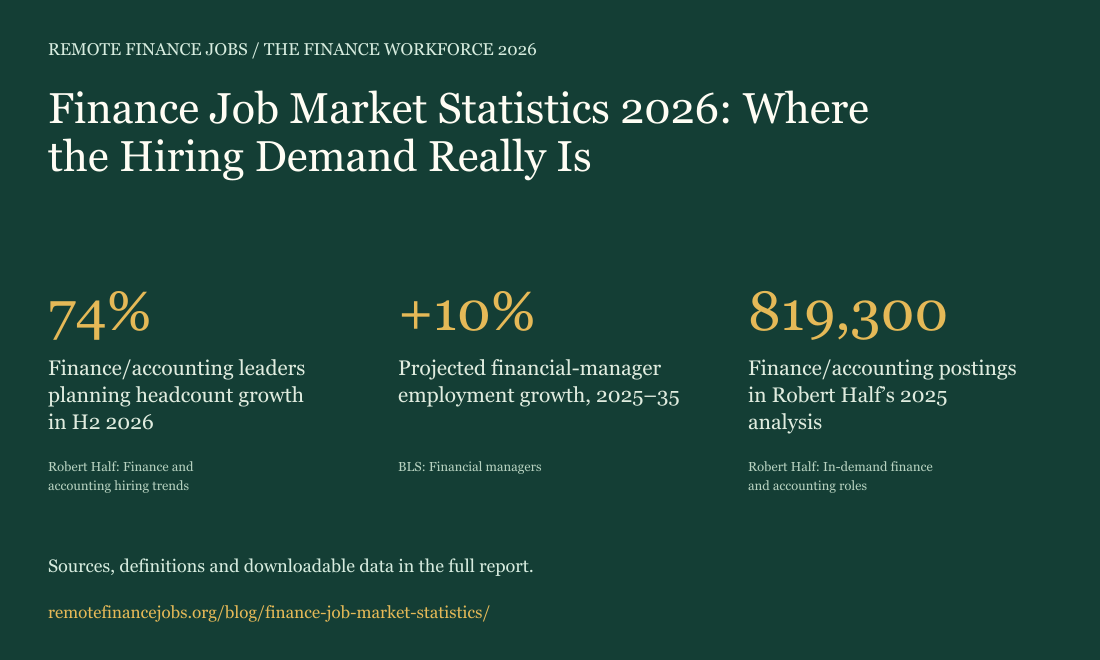
In Robert Half’s second-half 2026 research, 74% of finance/accounting leaders plan to grow permanent headcount and 63% plan increased contract hiring. Meanwhile, 61% report that finding skilled professionals has become harder. Source: finance and accounting hiring trends.
These percentages can overlap: one organization may plan both permanent and contract hiring. They should not be added to estimate the share of employers hiring, and an intention is not an observed addition to payroll.
| Employer indicator | Share | What it measures |
|---|---|---|
| Plan permanent headcount growth | 74% | H2 2026 intention |
| Plan more contract hiring | 63% | H2 2026 intention |
| Skilled hiring harder than last year | 61% | Reported hiring difficulty |
| Skills gaps caused project delays | 75% | Reported effects in the past year |
| Skills gaps caused project cancellations | 62% | Reported effects in the past year |
04 / THE DATA
What observed posting activity adds
Robert Half reports 819,300 US finance/accounting job postings in its 2025 analysis, including more than 231,000 general-accounting postings. Its project-impact findings identify planning/forecasting (45%), team capability building (44%), data access/completeness/security (39%) and ERP/financial-system upgrades (37%) among initiatives affected by skills shortages. Source: in-demand roles research.
A year’s flow of advertisements is different from the number open on a given day. Reposted advertisements, multi-location recruitment and the source’s occupational coverage affect posting totals. These figures should not be equated with completed hires or BLS annual openings.
05 / THE DATA
Pay and opportunity do not rank identically
The wage comparison uses May 2025 BLS medians. Financial managers lead this selected set on median wages, but the role sits at a different career stage from many analyst positions. The figures are occupational benchmarks across work arrangements, not remote-specific salaries.
Someone comparing career paths should examine the kind of work, required experience and accessible vacancies alongside pay. A high median can reflect the composition of the occupation rather than the starting offer a newcomer should expect.
| Occupation | May 2025 median annual wage | Reference |
|---|---|---|
| Accountants / auditors | $83,680 | BLS |
| Financial managers | $166,570 | BLS |
| Financial analysts (combined) | $103,570 | BLS |
| Personal financial advisors | $105,070 | BLS |
| Financial examiners | $94,160 | BLS |
| Budget analysts | $91,640 | BLS |
06 / THE DATA
A remote job search is a narrower market
Robert Half’s Q2 2026 finance/accounting posting analysis classifies 85% as on-site, 12% hybrid and 3% fully remote. This is a posting mix within its research coverage, not a census of every finance employee’s working arrangement. Source: remote-work research.
Our own board is built to surface remote-tagged opportunities, so its listing mix cannot estimate how common remote work is in the wider market. Use the salary report for the board’s original pay analysis and the remote accounting statistics for the distinction between telework access and fully remote recruitment.
RESEARCH NOTES
Methodology & reuse
This report was researched on September 8, 2026. Dates beside statistics identify the observation or forecast period; “2026” in the title is the publication edition. National occupational data cover all work arrangements. Employer surveys describe respondents, and projected openings are not a count of currently unfilled jobs.
You may reuse charts created by Remote Finance Jobs with a link to this article. Keep source credits, dates and population labels attached. Downloadable CSV files reproduce the article tables; follow their source links for the underlying publishers’ definitions. We have not conducted an independent national employer survey.
We use six named BLS occupational profiles with a common 2025–2035 projection period. Financial analysts is a combined group; the salary report also shows its two subgroups separately. No model converts projections or surveys into a 2026 vacancy estimate. Figures may be rounded by the original publisher.
Suggested citation: Remote Finance Jobs Research. “Finance Job Market Statistics 2026: Where the Hiring Demand Really Is.” September 8, 2026. https://remotefinancejobs.org/blog/finance-job-market-statistics/
Sources & reference periods
- BLS: Accountants and auditors ↗May 2025 wages; 2025–2035 projections; updated August 27, 2026 · Accessed September 8, 2026
- BLS: Financial managers ↗May 2025 wages; 2025–2035 projections · Accessed September 8, 2026
- BLS: Financial analysts ↗May 2025 wages; 2025–2035 projections · Accessed September 8, 2026
- BLS: Personal financial advisors ↗May 2025 wages; 2025–2035 projections · Accessed September 8, 2026
- BLS: Financial examiners ↗May 2025 wages; 2025–2035 projections · Accessed September 8, 2026
- BLS: Budget analysts ↗May 2025 wages; 2025–2035 projections · Accessed September 8, 2026
- Robert Half: Finance and accounting hiring trends ↗Second-half 2026 hiring intentions · Accessed September 8, 2026
- Robert Half: In-demand finance and accounting roles ↗2025 posting totals; 2026 salary guide and survey findings · Accessed September 8, 2026
- Robert Half: Remote work statistics and trends ↗Q2 2026 US job-posting analysis using TalentNeuron · Accessed September 8, 2026